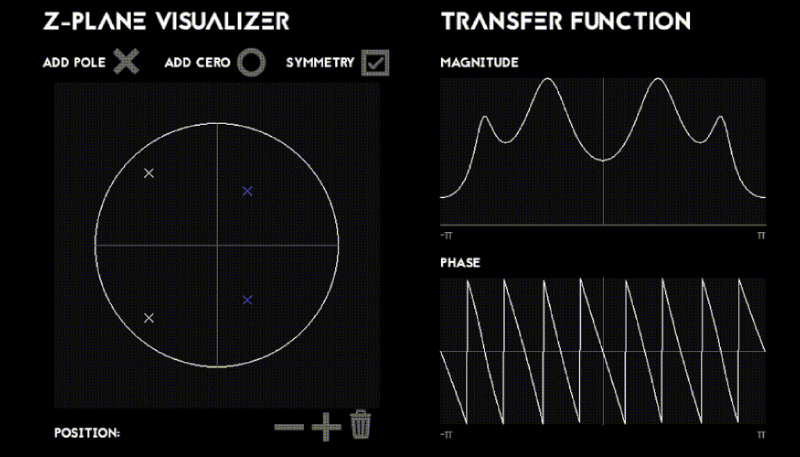
On the Procesamiento Digital de Señales (Digital Signal Processing) course at UNTREF, we explore the Z-Plane for filtering design with discrete variables. During the class, the professor introduced a tool built in MATLAB that visualizes the magnitude and phase plots in relation to the positions of zeros and poles on the Z-Plane. Inspired by this, I decided to recreate this tool in Python.
Leveraging my experience with the PyGame library, I was able to build a real-time application that allows for the movement of poles and zeros, enabling users to see how the transfer function changes in real time.
How It Works
First, I map the pixel positions on the Z-Plane to coordinates according to the unit circle representation. Then, I construct the transfer function, where each zero $z_{n}$ is a term in the numerator, and each pole $z_{i}$ is a term in the denominator. With the transfer function $H(z)$, I can plot both the magnitude and phase plots, which are also mappings from the normalized response into a space within the app.
$$ H(z) = \frac{\sum_{n=0}^{N} (z - z_{n})}{\sum_{i=0}^{N} (z - z_{i})} $$Each frame recalculates the transfer function. The program performs efficiently because I store the zeros and poles in arrays, enabling faster computations with the help of numpy, which is already highly optimized. This allows real-time visualizations of the changes and provides a more intuitive understanding of the behavior of the Z-Plane. The following code snippet shows how the transfer function is computed using complex exponentials:
| |
This project is designed as educational material, providing students with a practical tool to better understand the interactions between poles and zeros in the Z-Plane. It is not intended as a professional filter design tool.
Functionality
The application has the following functionality:
Display and move poles/zeros: The user can select and choose the position of zero or pole in the Z plane. With the symmetry option active, all the poles and zeros selected or moved are attached to their symmetric par with respect to the imaginary axes.
Order: The order of the poles/zeros can be modified with the mouse wheel up to increse or down to decrease. It supports up to order 4. The color of the zero/pole change with the order.
Information: Holding the cursor over a pole or zero displays information about the position, symmetry and order.
Zoom: With the plus and minus symbols, the user can zoom in and out of the Z plane.
Delete: The trash bin symbol clears all the poles and zeros from the plane, and the user can also delete specific poles or zeros by pressing right click on them.
Magnitude Graph: The magnitude spectrum displayed in the app is normalized. This decision helps to keep the focus on the shape of the magnitude and it makes sure that the graph is visually meaningful for the user. The downside is that the difference in peak values is not captured.
Phase Graph: The phase is displayed unwrapped between $-\pi$ and $\pi$.
Demo
Here is a quick demo of the app in action:
The source code for this project can be found on this repo.